Risk Assessment dashboard
Where: Risks and Compliance › Risk Assessment · Screen: /dashboard/risk
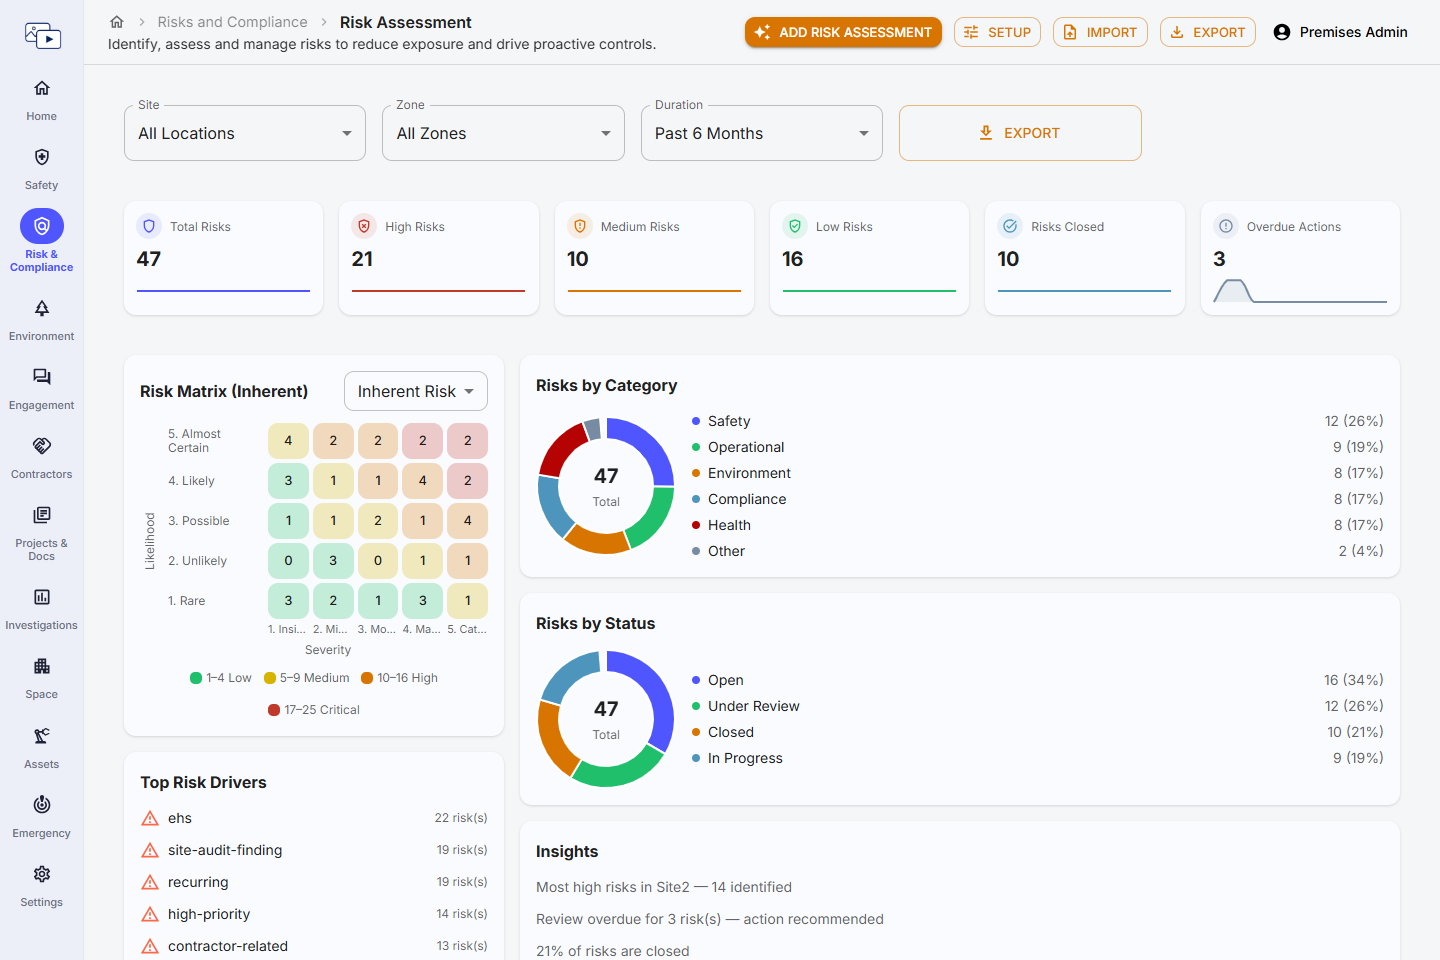
The Risk Assessment dashboard is your risk register. The top half summarises the risks in the current filters — counts by level, a heat map of where they sit on the risk matrix, the most common risk tags and quick insights. The table underneath lists every risk; click one to open it.
Top bar buttons
- Add Risk Assessment — Adds a new risk. Attach a photo or PDF (e.g. a method statement) and/or describe the risk, and AI drafts the assessment for you to review step by step. See Risk assessment form.
- Setup — Admins only — opens the first-use guide for this module (risk matrix, workflow, review reminders).
- Import — Adds many risks at once from an Excel/CSV file. Download the template from the same button — it lists every column, which are required and the allowed values.
- Export — Downloads the risks in the current filters as PDF, PowerPoint or Excel.
Filters
Filters apply to the tiles, matrix, charts and table.
| Filter | What it does | Options |
|---|---|---|
| Site | Risks of one site, or All Locations. Hidden when there is only one site. | All Locations, or a site |
| Zone | Risks of one zone (area/department) of the selected site. | All Zones, or a zone |
| Duration | How far back to look, based on the risk's Identification Date. | Past 1 Month, Past 3 Months, Past 6 Months, Past 1 Year |
| Export | Downloads the risks on screen as a CSV file. | Button |
Summary tiles
- Total Risks — All risks in the filters.
- High Risks / Medium Risks / Low Risks — Risks by their inherent risk level (before controls). High includes Critical.
- Risks Closed — Risks with status Closed.
- Overdue Actions — Risks that are not Closed and whose Next Review Date has passed.
Risk Matrix
A heat map of Likelihood × Severity with the number of risks in each cell. Switch between Inherent (before existing controls) and Residual (after controls). Click a cell to filter the table to the risks in it — a chip above the table shows the filter; clear it to see all risks again. The matrix size (3×3, 4×4 or 5×5) and the score bands for Low/Medium/High/Critical are set by your Org Admin under Settings › Risk Matrix.
Charts, insights and assistant
- Top Risk Drivers — The tags used most often on risks (see the Tags field), with a count.
- Risks by Category / Risks by Status — Doughnut charts of the risks in the filters.
- Insights — Where the most high risks are, how many risk reviews are overdue, and the percentage of risks closed.
- AI Risk Assistant — Ask questions about the risks on screen. Shown only when the AI Assistant is enabled for your organization.
Risk table
Search by text and filter by Location, Category, Risk Level and Status. Click a row to open the risk; the ⋮ menu has Edit and, for users with delete rights, Delete.
| Column | What it shows |
|---|---|
| Risk ID | Risk number, e.g. RISK-7C21. |
| Risk Title | Short name of the risk. |
| Category | Safety, Health, Environment, Compliance, Operational or Other. |
| Location | Site (and area) of the risk. |
| Inherent Risk | Level and score before existing controls. |
| Residual Risk | Level and score after existing controls. |
| Risk Owner | Person responsible for treating the risk. |
| Status | Open, In Progress, Under Review or Closed — or your workflow stage. |
| Review Date | Next Review Date. |
| SLA Adherence | Only with a risk workflow that has stage time limits. |
| Actions | The ⋮ menu: Edit, Delete. |