Incidents dashboard
Where: Safety Management › Incidents · Screen: /dashboard/org/all
The Incidents dashboard is where every incident for your organization (or your site) comes together: incidents raised by people with Raise Incident, and incidents raised automatically by cameras. Use the filters at the top to narrow the view, the tiles for a quick count of what is still active, and the list to open any incident.
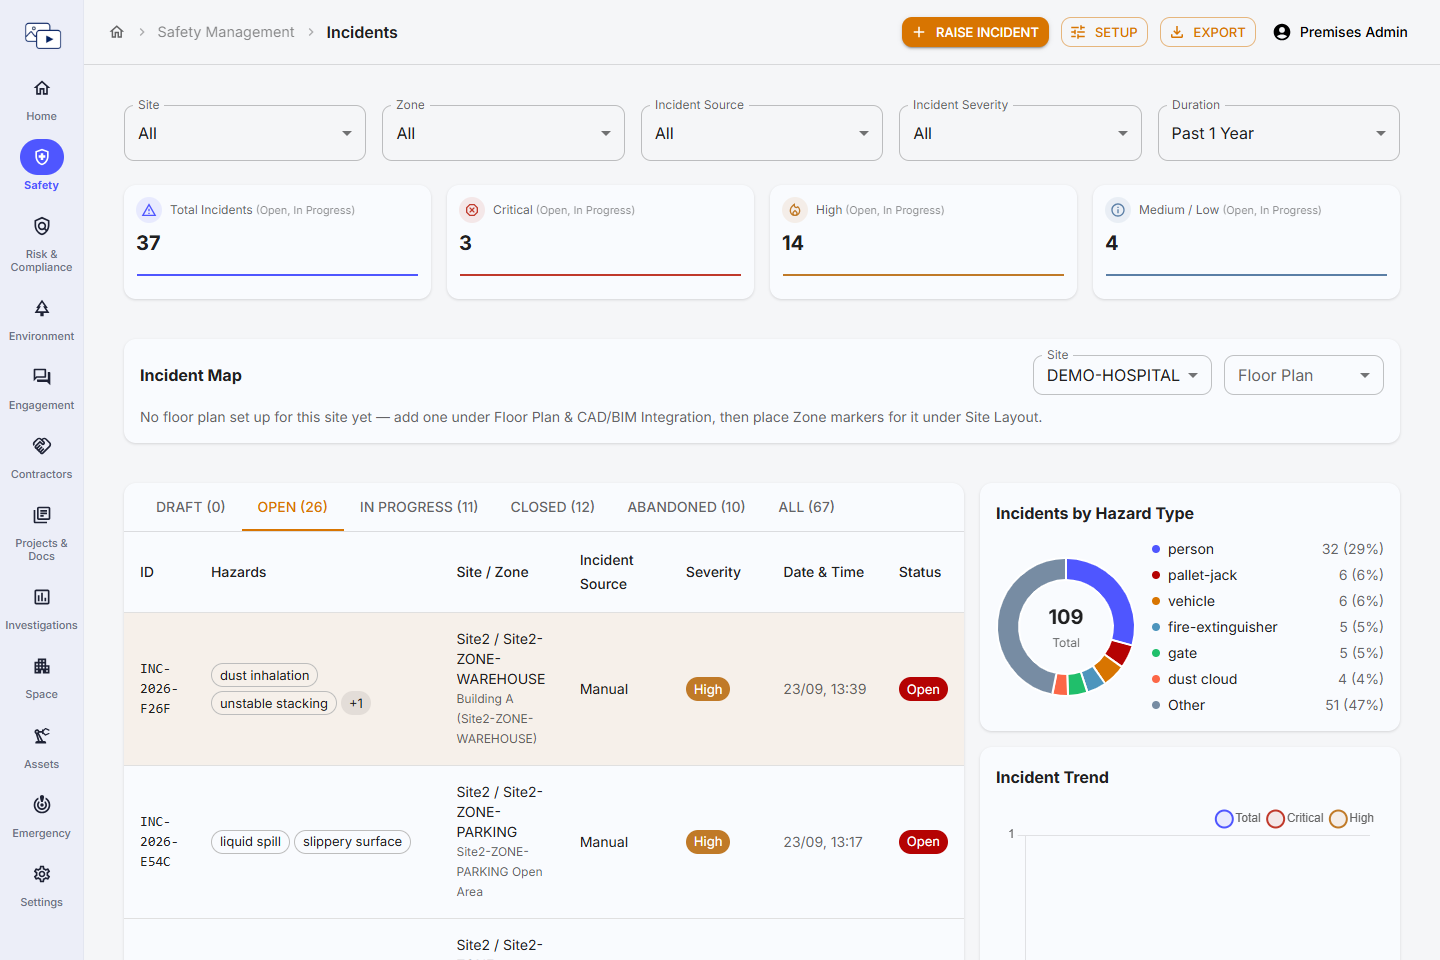
Top bar buttons
- Raise Incident — Opens the step-by-step form to report a new incident. See Raise an incident.
- Setup — Admins only — opens the first-use guide for this module (response protocols and the incident workflow).
- Export — Downloads the incidents in the current filters as PDF, PowerPoint or Excel.
Filters
Filters apply to the tiles, the map, the charts and the list together.
| Filter | What it does | Options |
|---|---|---|
| Site | Show incidents for one site, or All. Hidden when your organization has only one site, or you belong to one site. | All, or any site you can access |
| Zone | Show incidents for one zone of the selected site. Hidden when the site has only one zone. | All, or any zone of the selected site |
| Incident Source | Who raised the incident: a person (Manual Incidents) or a particular camera. | All, Manual Incidents, or a camera ID |
| Incident Severity | Show only incidents of one severity. | All, Critical, High, Medium, Low |
| Duration | How far back to look, based on when the incident was recorded. Custom Range shows Start Date and End Date pickers. | Today, Past 7 Days, Past 1 Month, Past 3 Months, Past 6 Months, Past 1 Year, Custom Range |
Summary tiles
Each tile counts active incidents only — status Open or In Progress — and shows a 14-day trend line.
- Total Incidents — All active incidents.
- Critical — Active incidents with severity Critical.
- High — Active incidents with severity High.
- Medium / Low — Active incidents with severity Medium or Low.
Incident Map
Shows the site's floor plan with a marker per zone and the number of open and in-progress incidents in it. Pick the Site and Floor Plan in the panel. If no floor plan has been set up yet, the panel says so — an admin adds one under Floor Plans and places the zone markers under Settings › Site Structure.
Incident list
Tabs above the list split incidents by status: Draft, Open, In Progress, Closed, Abandoned and All, each with a count. Team members (the plain User role) also get My Queue when an incident workflow is set up — the incidents waiting on a stage your team is responsible for. Click a row to open the incident.
| Column | What it shows |
|---|---|
| ID | Incident number, e.g. INC-2026-3F9A (year recorded + last four characters of its internal ID). |
| Hazards | The hazards on the incident — chosen by the reporter, or detected by AI/camera. |
| Site / Zone | Where it happened. |
| Incident Source | "Manual" for incidents raised by a person, otherwise the camera that detected it. |
| Severity | Critical, High, Medium or Low. |
| Date & Time | When the incident was recorded in Premise360. |
| Status | Current status, or the current workflow stage if your organization uses an incident workflow. |
| SLA Adherence | Only with a workflow that has time limits per stage: whether the incident is within its stage time limit, close to it, or past it. |
Charts and assistant
- Incidents by Hazard Type — Doughnut chart of incidents in the current filters, grouped by hazard.
- Incident trend — Daily count over the last 14 days — total, Critical and High.
- AI Incident Assistant — Ask questions about the incidents on screen, e.g. "How many critical incidents are still open?". Shown only when the AI Assistant is enabled for your organization.